
Project Information
- Title: Classification Algorithm Evaluation
- Tech: Python
- Date: May 2022
- Presentation: View Slides
- Report: View PDF
- Code: View Notebook
About
Objective
My team wanted to practice using supervised classification techniques with hyperparameter tuning to determine the best algorithm by dataset. We selected k-Nearest Neighbor, Naive Bayes, and Convolutional Neural Network algorithms for our evaluation and used them on the Cho, Iyer, and MNIST datasets as described below.
Datasets
Cho and Iyer are gene sequence datasets.
Cho et al. (1998) released a 15 point time-series of cdc28-13 yeast cultures undergoing mitosis with data collected every 10 minutes, showing nearly two full cell cycles. Ground truth data provided with the dataset showed 5 distinct classes.
Iyer et al. (1999) released an 11 point time-series of 517 gene probes during the first 24 hours of serum stimulation in serum-starved human fibroblasts. There are 11 distinct classes this set. We also note that one of these classes is a noise data class which was removed prior to running the classification algorithms.
MNIST is a subset of the NIST dataset of 60,000 size-normalized and centered images of handwritten digits 0-9, split into training, validation, and test sets. Because the images are black and white, the pixels are represented as a 1x28x28 array.
Hyperparameters
For KNN, we varied the number of nearest neighbors (k), the type of voting (uniform or distance-weighted), and the distance metric used (L1 norm, L2 norm, or cosine distance). The best results came from k=15, distance-weighted voting, and the L2 norm for the Cho dataset. For the Iyer dataset, k=5, distance-weighted voting, and cosine distance were the best. For the MNIST dataset, k=5, unweighted (uniform) voting, and the L1 norm performed the best.
For Naive Bayes, we ran cases with three distinct functions: Gaussian, Multinomial, and Complement. We found the best performance with the Gaussian model for Iyer and Cho datasets and Multinomial for MNIST.
For CNN, we varied the batch size and number of epochs, finding that a batch size of 32 and 30 epochs gave the best model across all sets.
Evaluation
Our evaluation relies on accuracy, F1 score, and area under the ROC curve. We used three-fold cross-validation on the smaller Cho and Iyer datasets and ten-fold cross-validation on the MNIST dataset. For each measurement, we averaged results across three additional iterations.
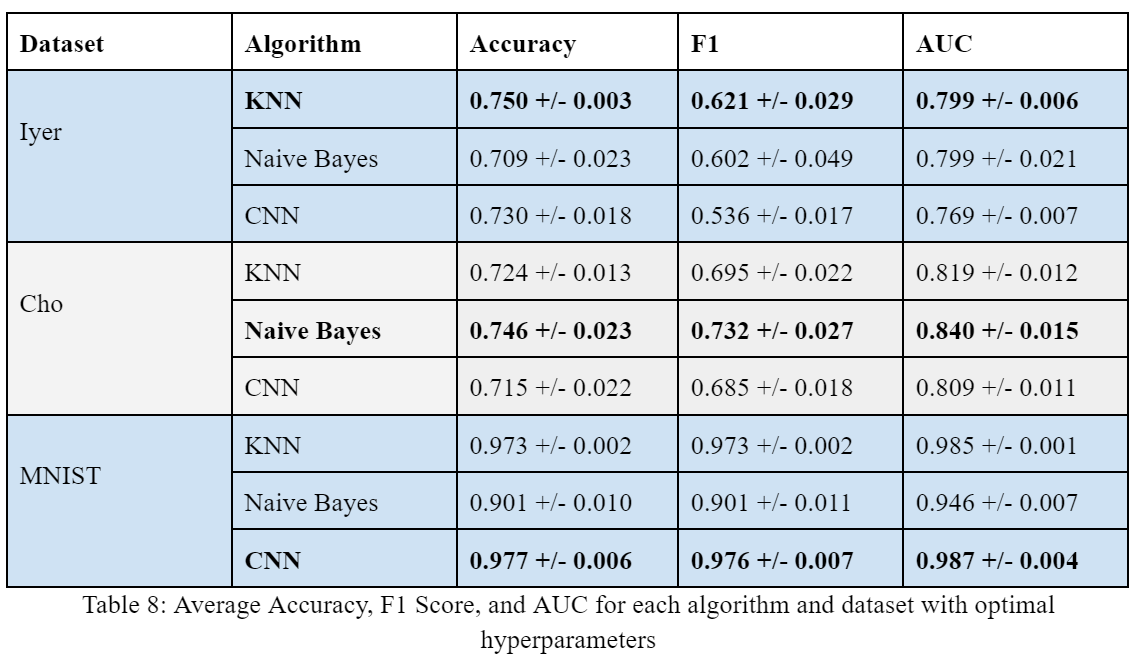
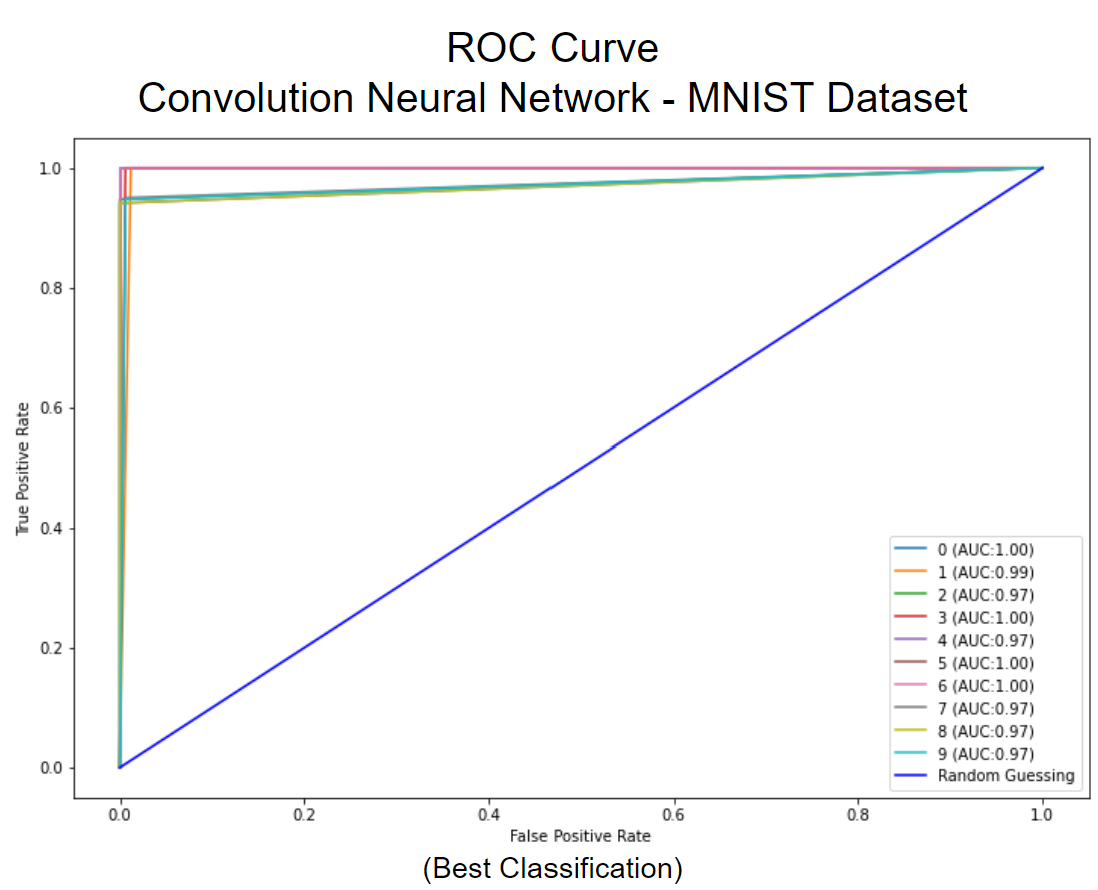
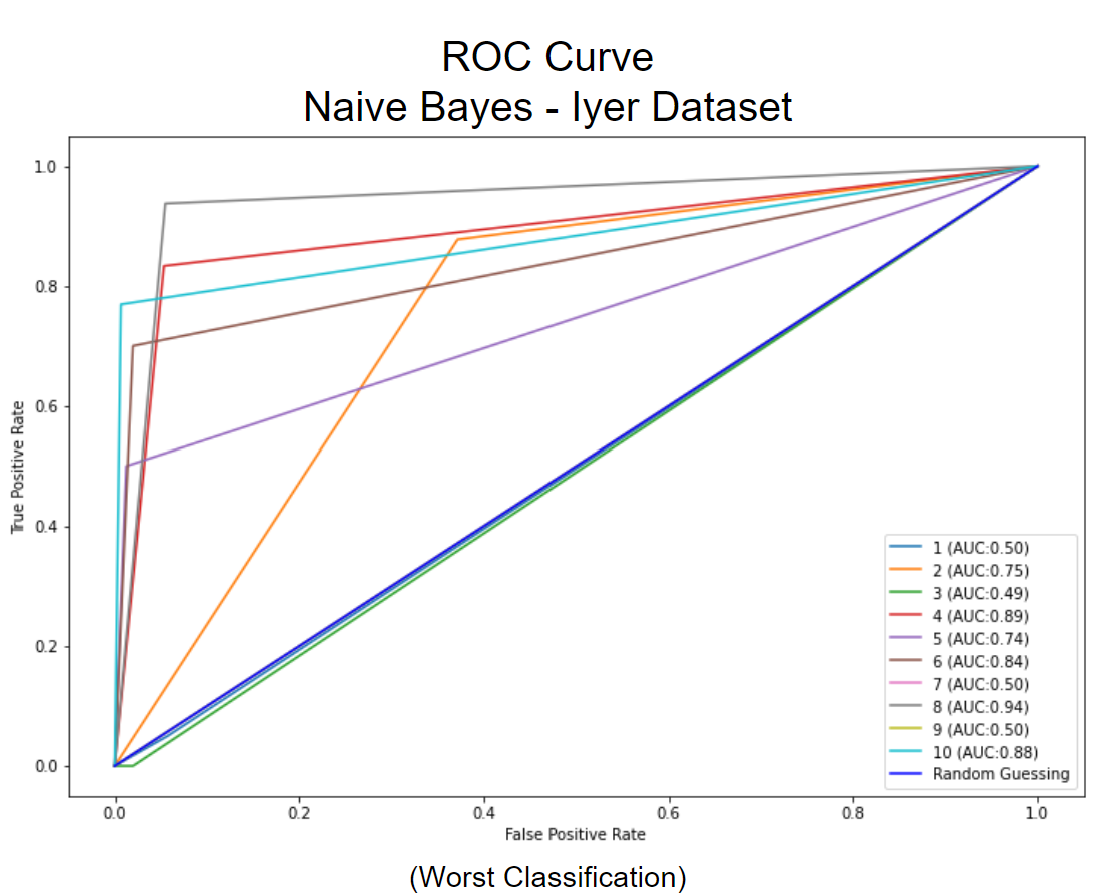
Using the optimal hyperparameters for each algorithm, we found that Naive Bayes performed best on the Cho dataset with an accuracy of 0.746 +/- 0.023, F1 score of 0.732 +/- 0.027, and AUC of 0.840 +/- 0.015. KNN performed best on the Iyer dataset with an accuracy of 0.750 +/- 0.003, an F1 score of 0.621 +/- 0.029, and an AUC of 0.799 +/- 0.006. CNN performed best on the MNIST dataset with an accuracy of 0.977 +/- 0.006, an F1 score of 0.976 +/- 0.007, and an AUC of 0.987 +/- 0.004.
For each algorithm, we saw comparable performance by dataset despite the very different computation methods. While we would expect CNN to perform best on MNIST image data, its accuracy was only slightly higher than KNN and was much more computationally expensive. In this general case, we do not feel that the 0.4% difference in accuracy is justified for the much expense required by the CNN algorithm. We also note here that the significant difference in performance between the MNIST and Cho and Iyer datasets is likely due to the size and scale of the sets. MNIST is trained from 60,000 instances while Cho and Iyer each have less than 1,000 instances.